Hardware Components
| Component | Model / Type | Qty |
|---|---|---|
| Arduino UNO | R3 Board | 1 |
| TCRT5000 IR Sensor | Reflective IR Module | 1 |
| OLED Display | SSD1306 128×64 I2C (0.96″) | 1 |
| Jumper Wires | Male-to-male | 1 set |
| Breadboard | Optional | 1 |
| USB Cable | For Arduino | 1 |
Schematic
Wiring / Connections
| Component | Arduino UNO | Notes |
|---|---|---|
| OLED VCC | 5V or 3.3V | Power for display |
| OLED GND | GND | Ground |
| OLED SDA | A4 | I2C Data |
| OLED SCL | A5 | I2C Clock |
| TCRT5000 VCC | 5V | Power for sensor |
| TCRT5000 GND | GND | Ground |
| TCRT5000 A0 / OUT | A0 | Analog sensor output |
Arduino Code
#include <Adafruit_GFX.h>
#include <Adafruit_SSD1306.h>

#define SCREEN_WIDTH 128
#define SCREEN_HEIGHT 64
#define OLED_RESET    -1
Adafruit_SSD1306 display(SCREEN_WIDTH, SCREEN_HEIGHT, &Wire, OLED_RESET);

const int sensorPin = A0; // IR sensor analog output pin

void setup() {
  Serial.begin(9600);
  pinMode(sensorPin, INPUT);

  if (!display.begin(SSD1306_SWITCHCAPVCC, 0x3C)) {
    Serial.println(F("OLED init failed"));
    for (;;);
  }
  display.clearDisplay();
  display.setTextColor(SSD1306_WHITE);
}

void loop() {
  int sensorValue = analogRead(sensorPin);
  int barLength = map(sensorValue, 640, 30, 0, 120); // Closer = longer bar
  barLength = constrain(barLength, 0, 120);

  display.clearDisplay();

  // Draw bar graph
  display.fillRect(4, 30, barLength, 10, SSD1306_WHITE);

  // Display numeric value
  display.setCursor(4, 10);
  display.setTextSize(1);
  display.print("IR Value: ");
  display.println(sensorValue);

  // Optional scale lines
  for (int i = 0; i <= 120; i += 20) {
    display.drawLine(4 + i, 28, 4 + i, 42, SSD1306_WHITE);
  }

  display.display();
  delay(100);
}
This program reads analog values from the TCRT5000 IR sensor and converts them into a visual bar graph on the SSD1306 OLED screen.
Key Features:
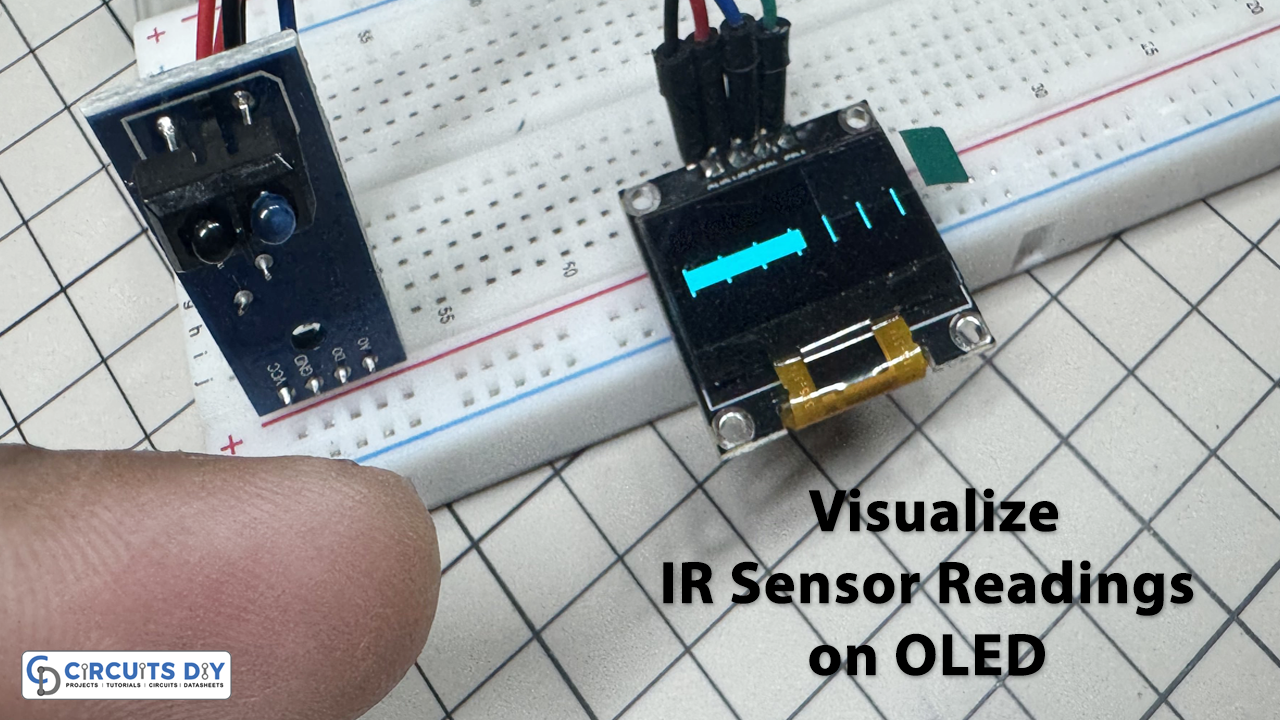
- Live bar graph that grows as objects get closer
- Text display showing the exact IR value
- Optional scale markers every 20 pixels
Code Walkthrough
int sensorValue = analogRead(sensorPin);- Reads analog output from the IR sensor.
int barLength = map(sensorValue, 640, 30, 0, 120);- Maps sensor values (from dark to reflective surfaces) into a bar range (0 to 120 px). Higher reflectivity (closer object) gives a longer bar.
barLength = constrain(barLength, 0, 120);- Ensures the bar doesn’t go out of bounds.
display.fillRect(4, 30, barLength, 10, SSD1306_WHITE);- Draws the bar horizontally on screen.
display.setCursor(4, 10);
display.print("IR Value: ");- Prints the numeric sensor value above the bar.
for (int i = 0; i <= 120; i += 20) {
  display.drawLine(4 + i, 28, 4 + i, 42, SSD1306_WHITE);
}
Draws vertical ticks every 20 pixels to serve as visual reference markers.